
iPlayer: Up to 27% of all viewing
IBC is just around the corner, which means it’s time for my annual look at how the BBC’s broadcast-to-OTT transition is going. I’ve been publishing this since 2019 via Freedom of Information requests, since iPlayer’s device-level usage isn’t published regularly.
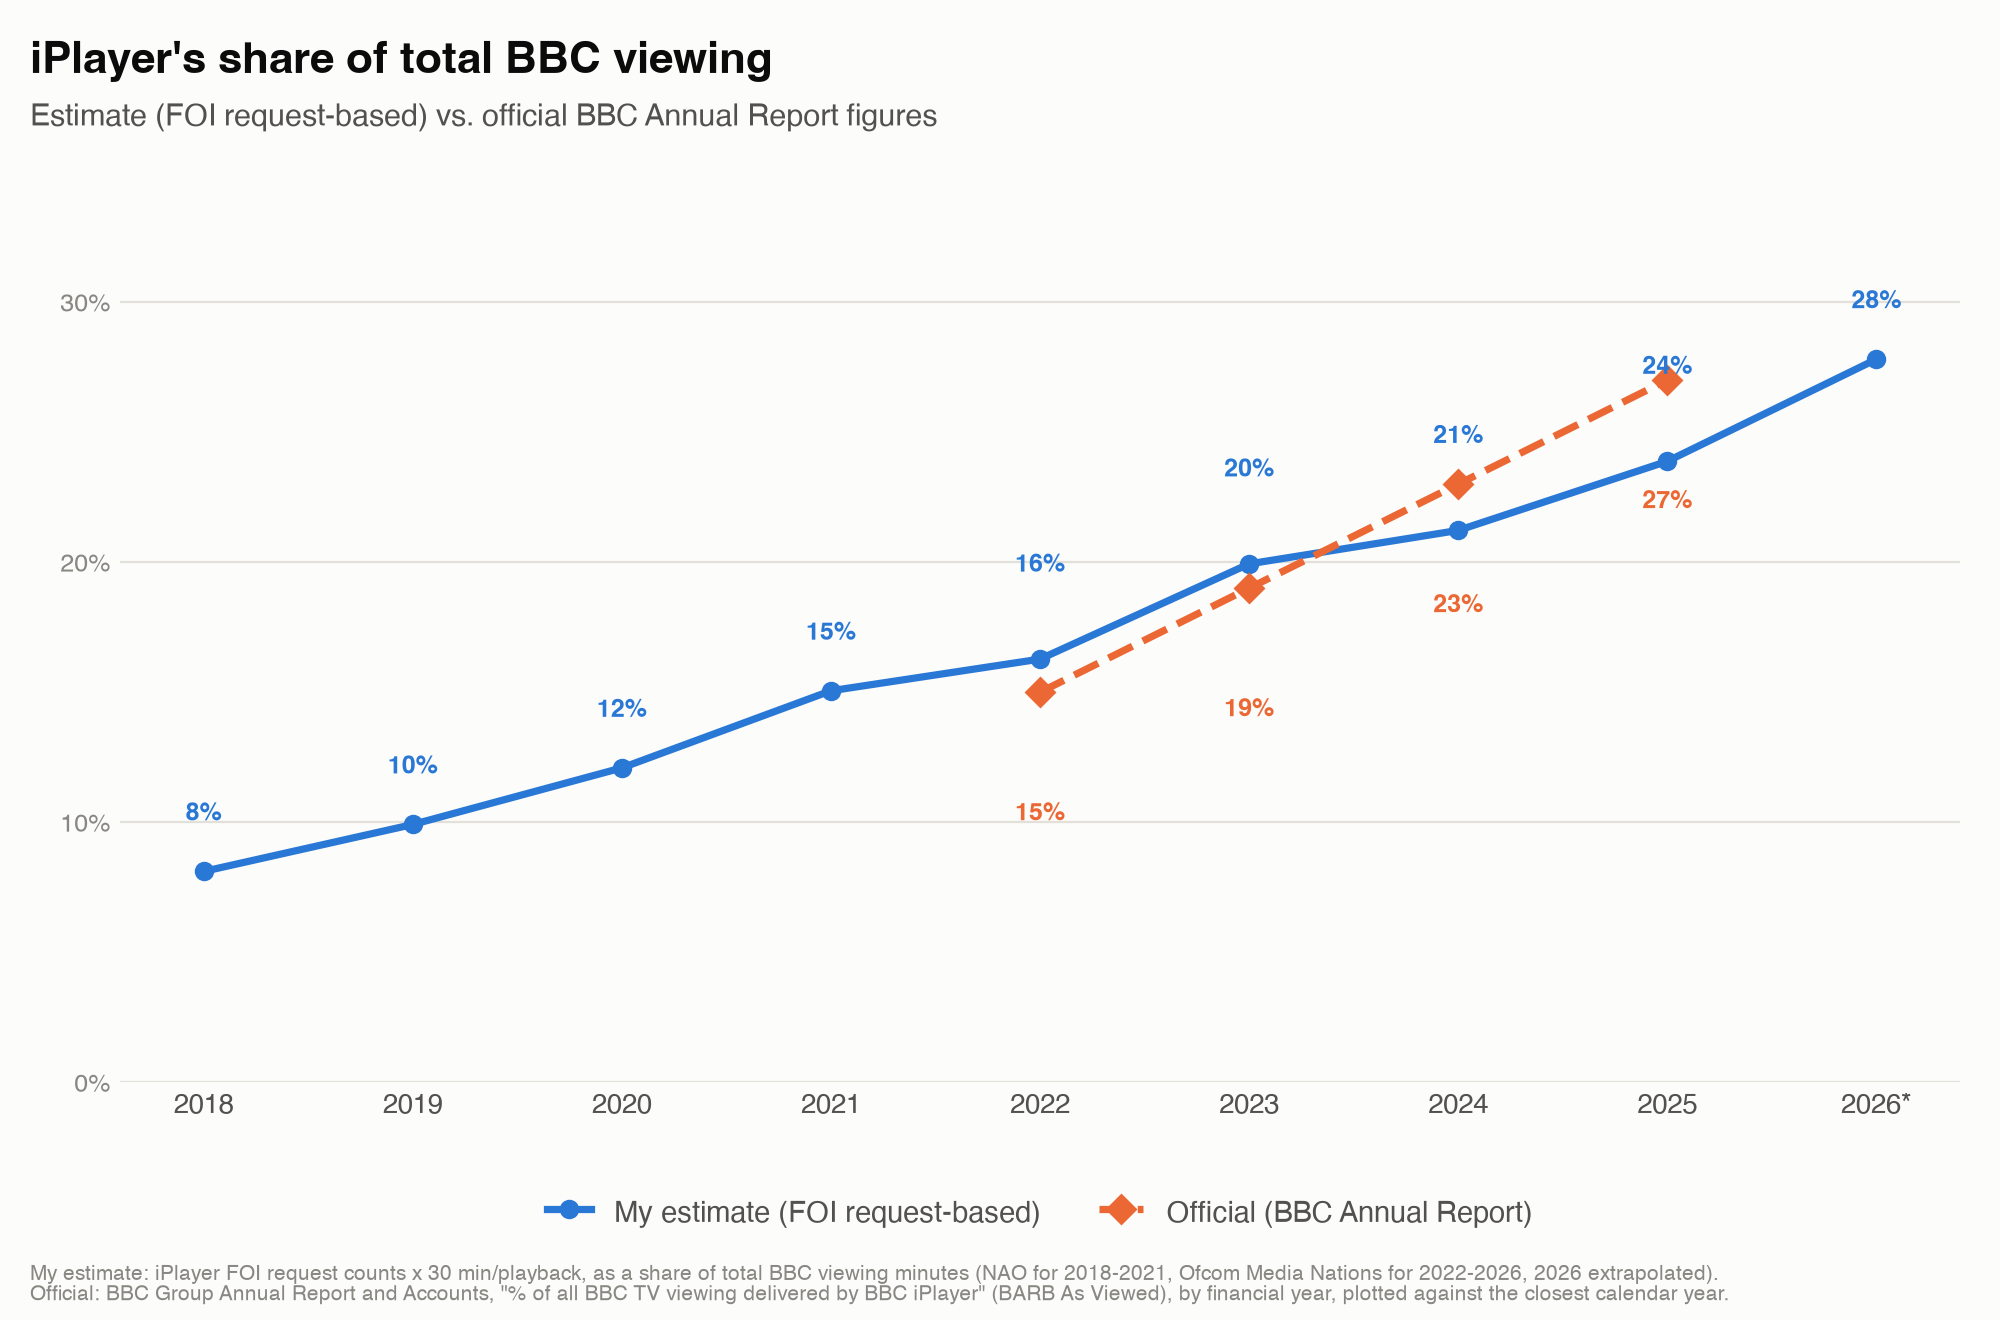
We’re now up to 27% of all BBC viewing on iPlayer (the rest being broadcast platforms) — we can expect to see that rapidly accelerating - 16-34’s are already up to 63%. This mirrors what I’m seeing on PayTV services around the world - there is likely to be rapid transition to OTT delivery, as the tipping point economically is being reached. Financially investment in new (non internet) broadcast delivery is looking harder and harder to justify.
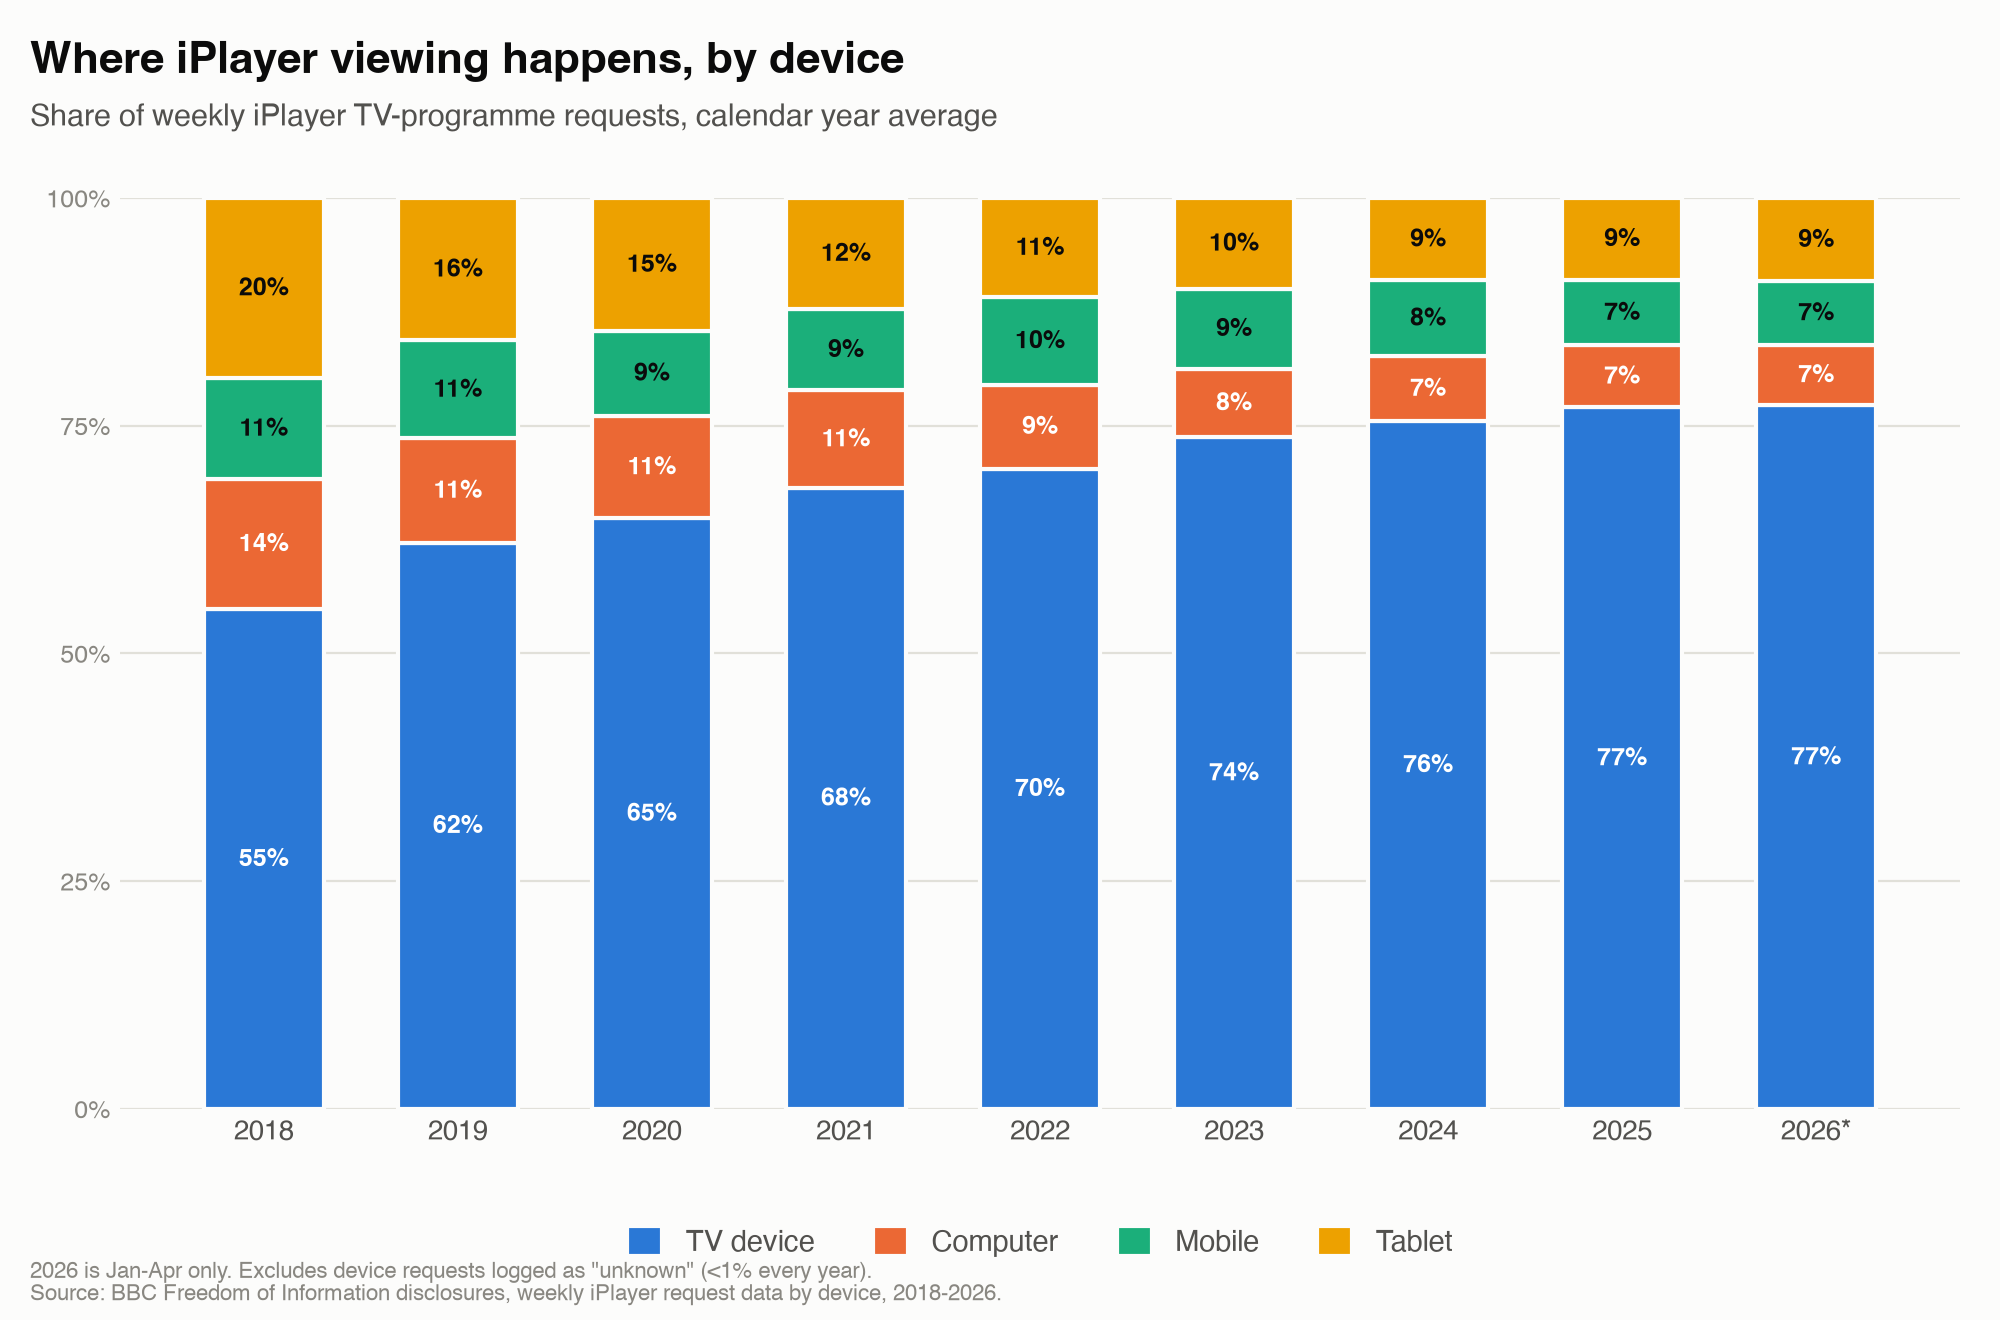
TV device share of requests has gone from 55% in 2018 to 77% so far in 2026. I said back in 2022 that it was nearly impossible to buy a TV in the UK without iPlayer built in; four years on, three-quarters of all iPlayer viewing now happens on exactly that kind of device. That’s not the whole picture though — it looks like TV is winning at everything else’s expense, but it isn’t.
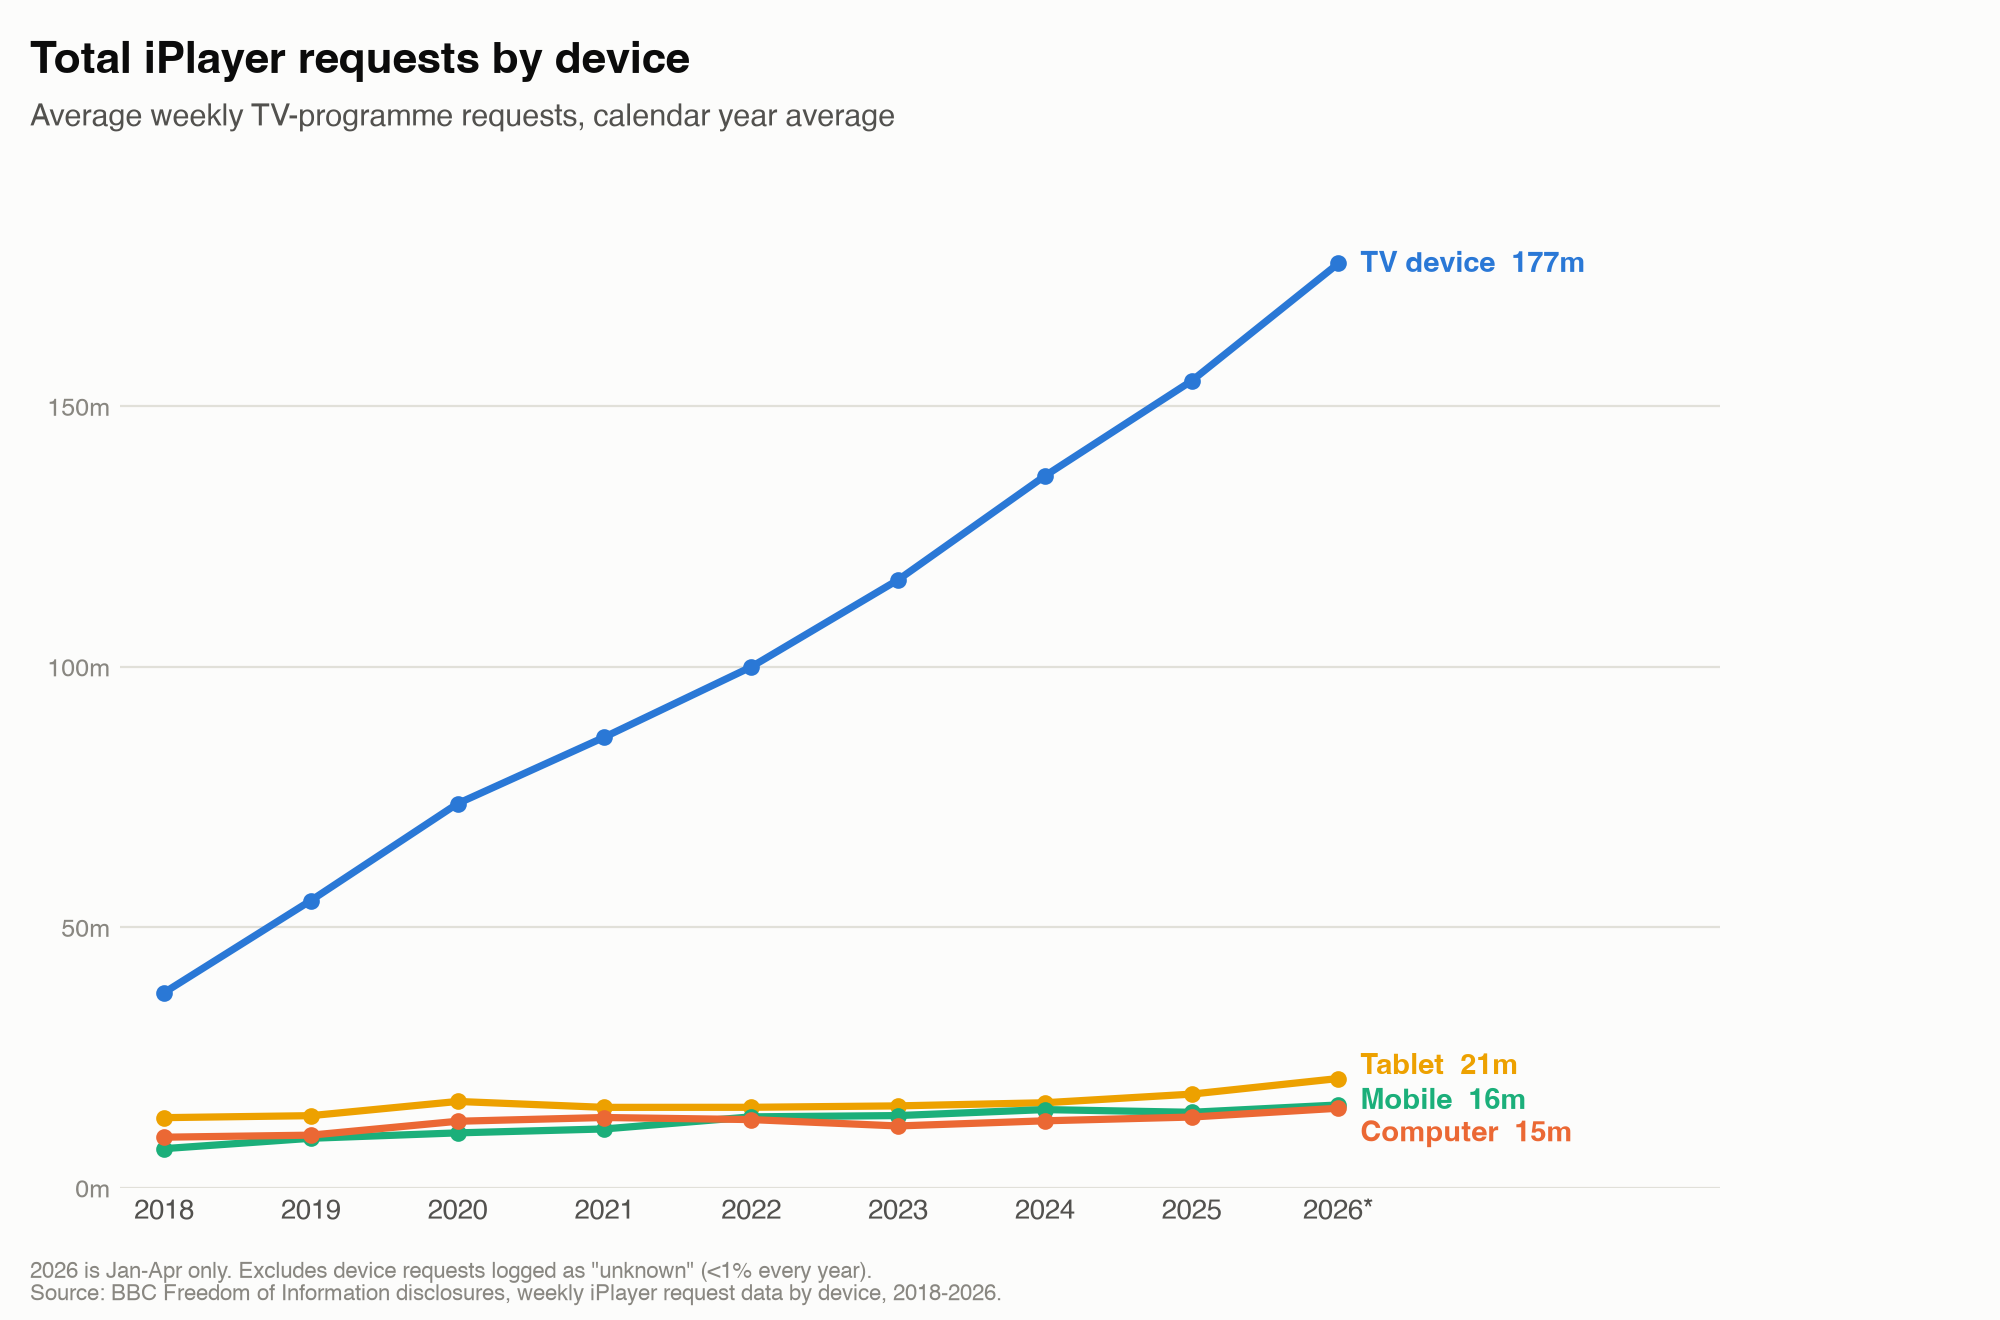
In absolute terms, computer, mobile and tablet requests have all grown too, just slowly — a few million a year, mostly flat since 2020. TV device requests, meanwhile, have gone from 37m a week to 177m. The share shift isn’t smaller screens losing viewers, it’s the big screen adding them roughly five times faster than everything else combined.
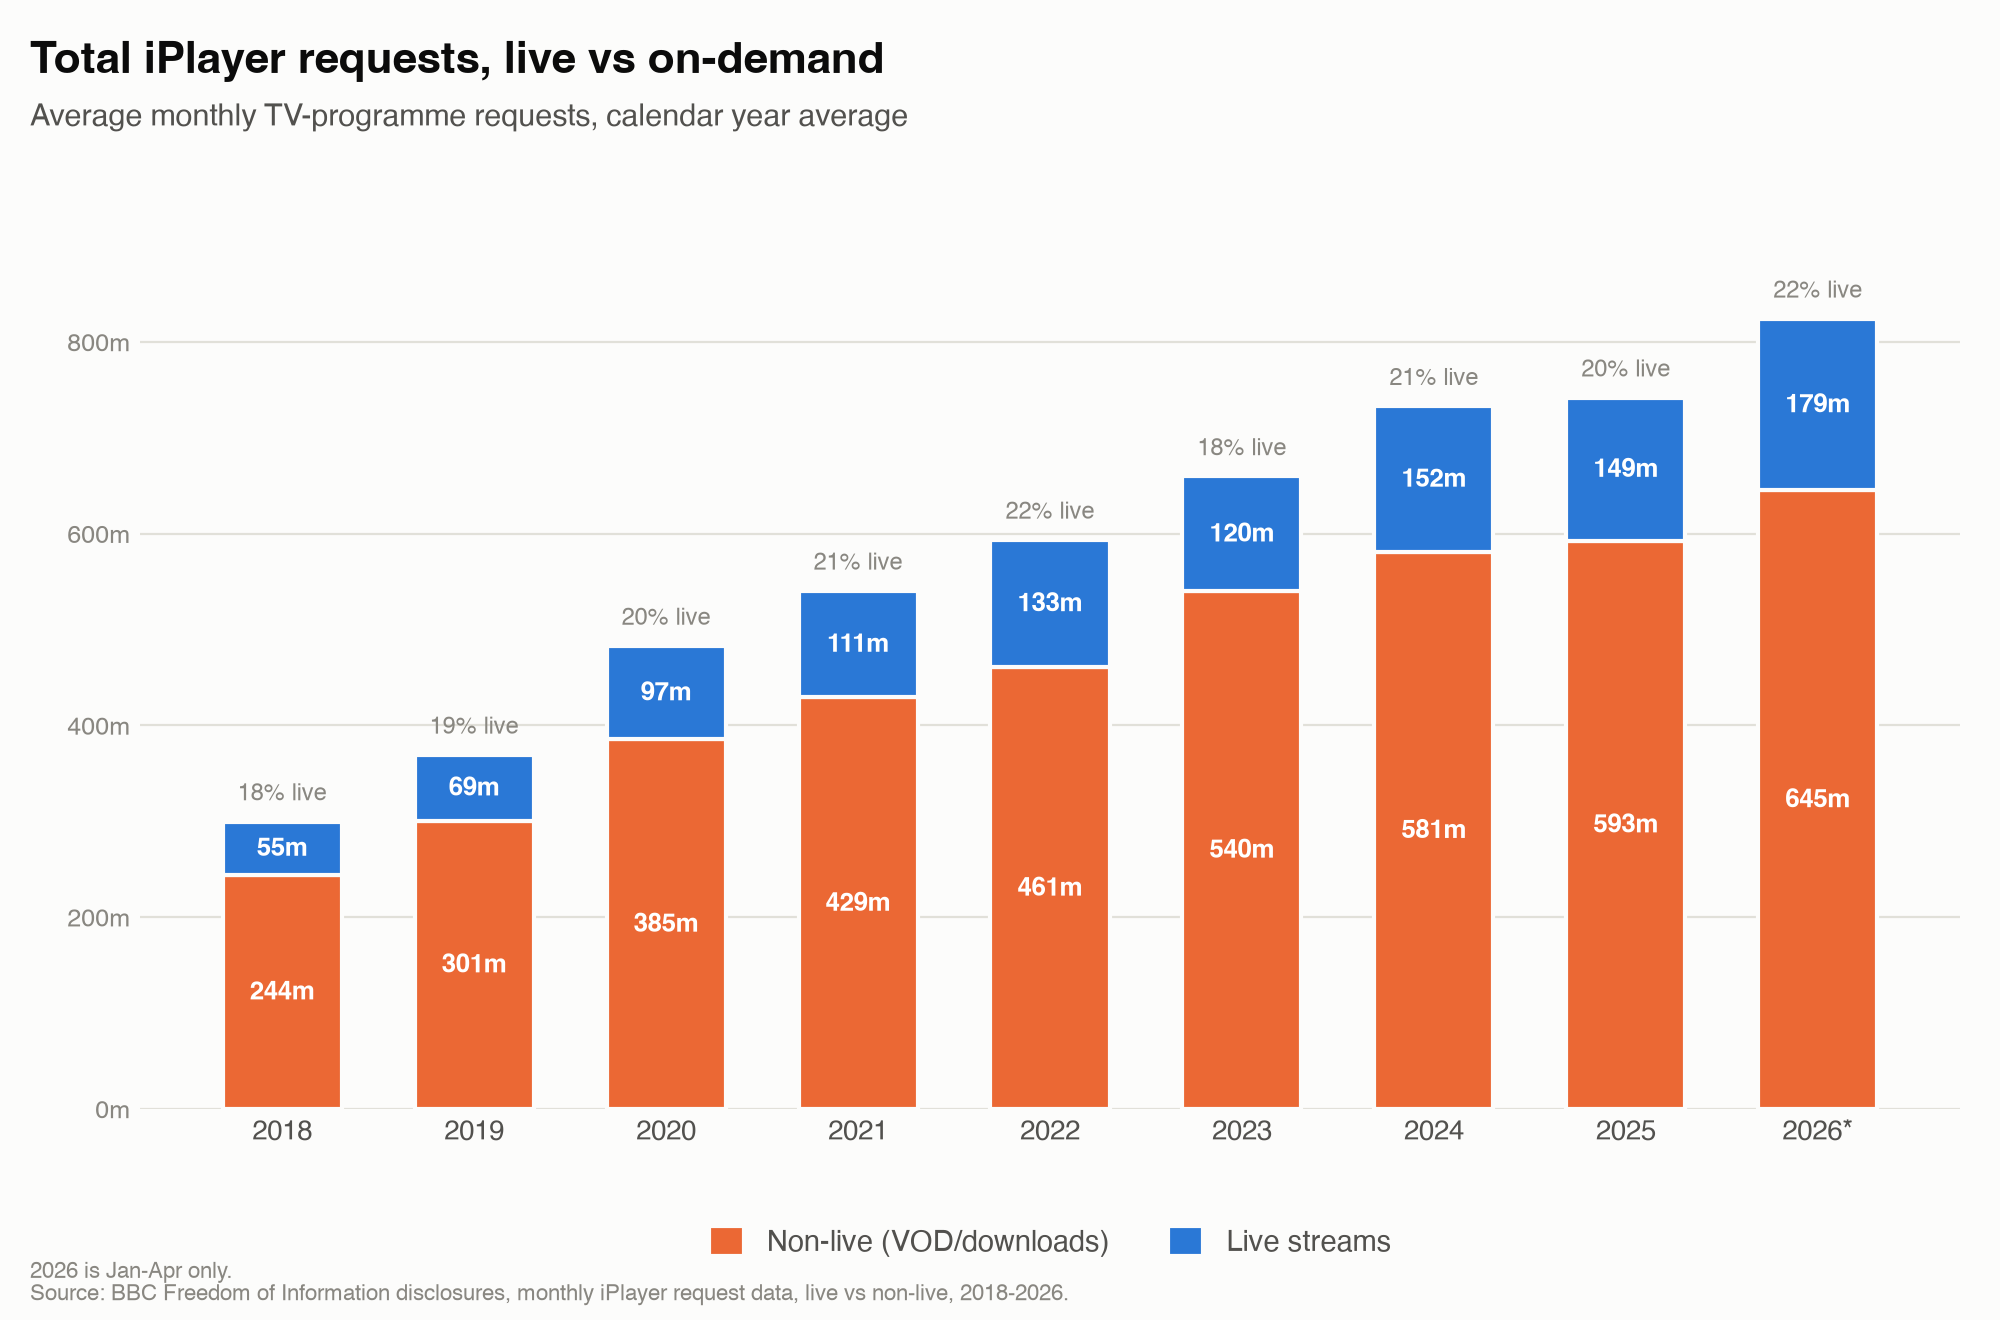
Live holds its ground the same way it has every year I’ve looked: 18-22% of requests, no clear trend up or down since 2018, even as total on-demand volume has nearly tripled.
I’m on the NAGRAVISION stand (1.C81) at IBC as usual — come and find me if you want to talk through the rest of the data or just say hello!