
OpenTV: Actionable Rails Analytics
Most analytics on a TV interface end up in the same place: a dashboard someone checks once a quarter. This is useful for a retrospective, useless in the moment when a rail is actively showing the wrong things to the wrong person.
Actionable Rails Analytics, is built on a simpler premise — measurement should feed straight back to the person and systems managing the rail it’s measuring, not into a report about the rail. Engagement signals on individual tiles get tracked live, and that signal directly is available to the editor curating the rails.
In practice that means the numbers live in the same screen you use to build the page. Turn Stats on in Rails Builder and every rail carries its own impressions, clicks, plays, completions and purchases, with the movement against the previous period, sat directly under the tiles it’s describing.
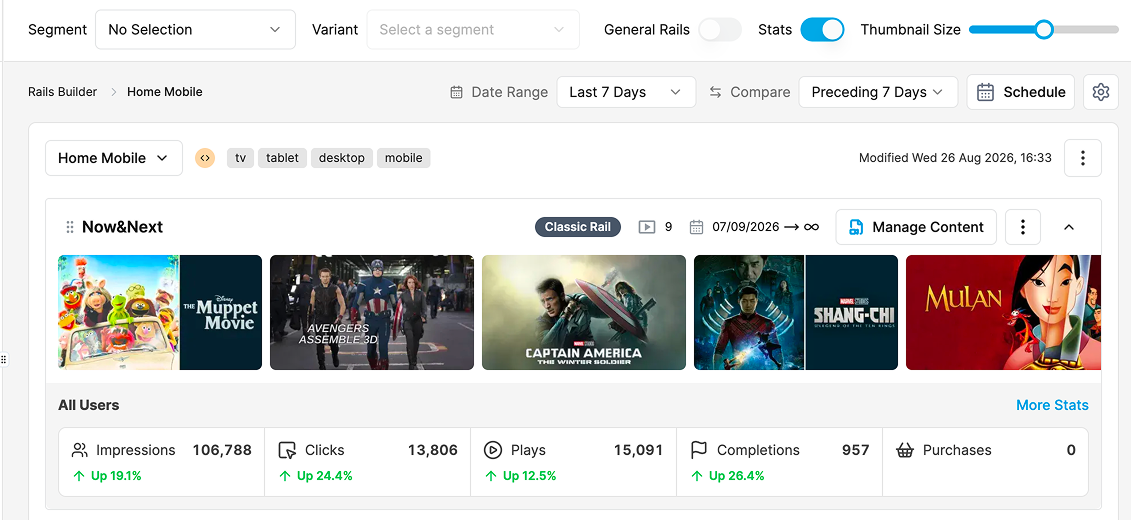
So if a rail is under-performing you see it while you’re editing it, and the fix — reorder it, reweight it, swap the content — is one click away in the same tool.
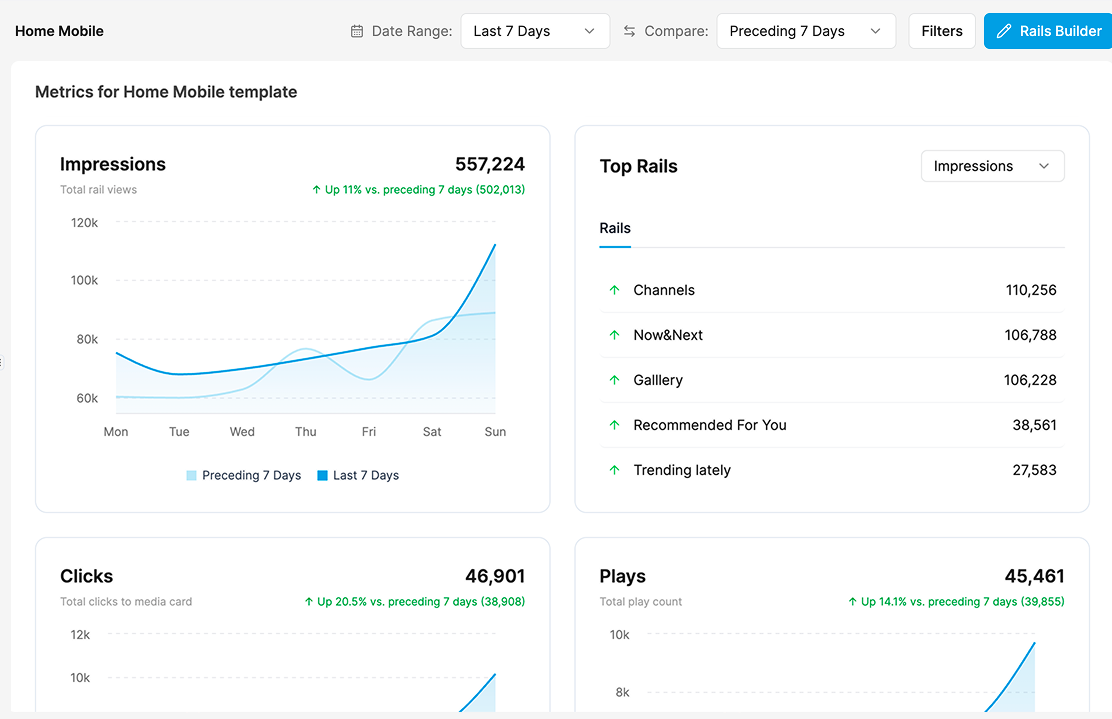
Zoom out and the same data rolls up to the template. Impressions, clicks and plays for the whole page, plus a ranked list of rails by whichever metric you care about — which is usually the fastest way to spot that something you thought was a headline rail is being beaten by a channel list.
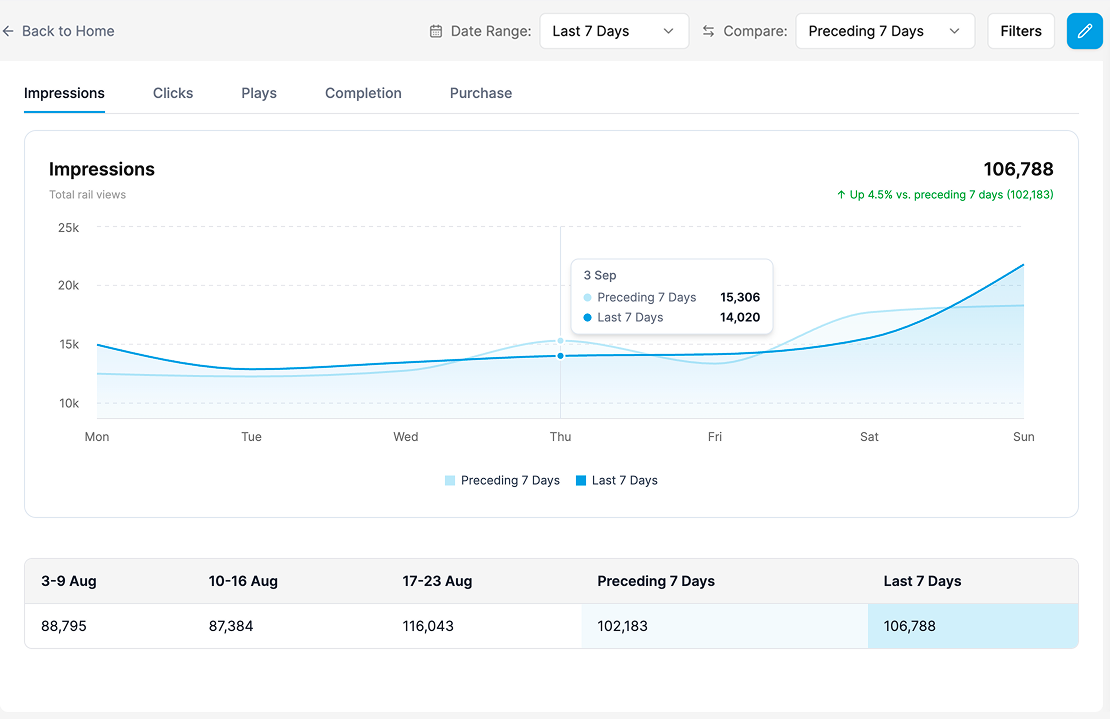
And you can drill into a single rail to see the trend against the preceding period, week by week.
This shows up in how the rail behaves at the point you make the decision on what to do next. This works alongside all the automatic features to put content in rails (recommendations, segments, metadata driven etc)
That’s the last of the OpenTV Invents posts before IBC — I’m on the NAGRAVISION stand (1.C81) all week if you want to talk through any of the three.